

Here’s what keeps forestry researchers up at night: How do you monitor thousands of trees across vast plantations when a single commercial dendrometer costs several thousand dollars? You don’t. At least, you couldn’t – until now.
Christopher Erasmus, under supervision of Professors Thinus Booysen and Dave Drew, developed a new wireless dendrometer system that changes everything. For this work, the IMPACT Open Air Lab, represented by Erasmus, was awarded the 2025 Transformative Research Challenge (TRC) Forestry Innovation Prize at the World Food Forum, held at the Food and Agriculture Organization of the United Nations (FAO) headquarters. With his system, researchers can deploy accurate, solar-powered monitoring stations that match the performance of equipment costing 10 times more.
Cost aside, it will also help democratise access to precision forestry tools, particularly in regions where research budgets can’t stretch to cover proprietary systems. And the timing matters. Eucalyptus plantations now cover nearly 20 million hectares globally, supplying raw materials for renewable energy, pulp production, and eco-friendly wood products that cannot be managed blind.
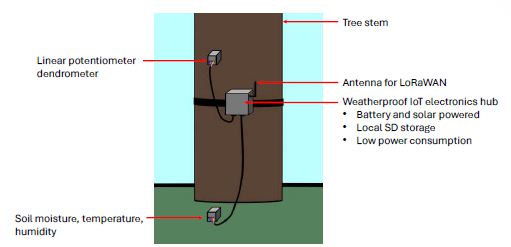
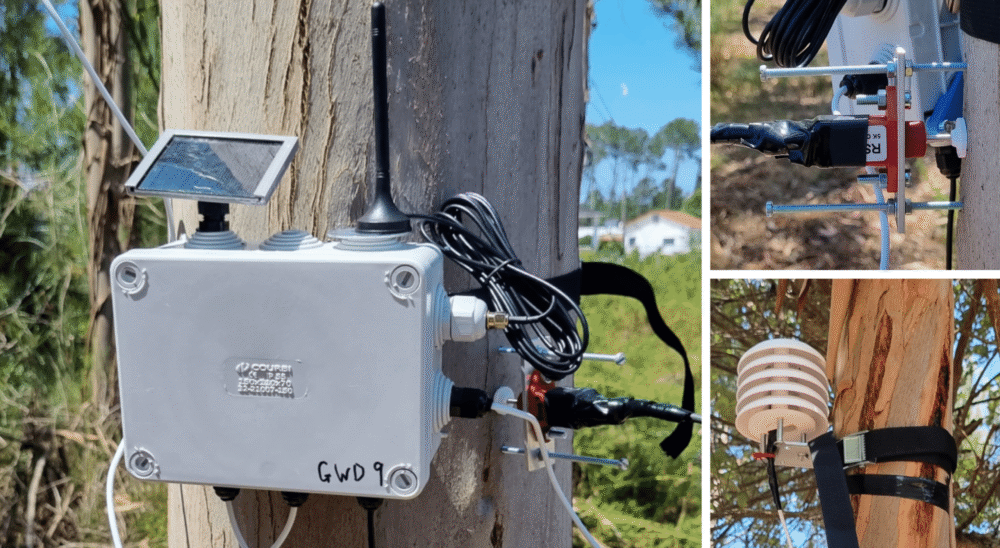
Figure 1: The proposed system concept. A central IoT electronics hub gathers data from peripherals, stores data locally on an SD card and in the cloud, has low power consumption, and is powered by a battery and solar panel.
Why Traditional Monitoring Falls Short
Dendrometry, measuring tree growth dynamics and stem diameter variations, has always been expensive. Labs in Europe and North America deploy high-precision instruments that capture micron-level changes in tree diameter throughout the day. These devices cost $3,000 to $5,000 each.
This can create a challenge because when you’re studying forest dynamics, you need multiple measurement points. A single tree doesn’t tell you much. You need 10, 20, maybe 50 sensors across different species, ages, and environmental conditions. Suddenly, you’re looking at a six-figure budget just for hardware. This often locks out researchers in less affluent regions entirely.
Even when institutions can afford commercial systems, they face another barrier: proprietary design. Most manufacturers don’t let you modify hardware or customise data collection parameters. You get what they built, regardless of whether it fits your research needs. The software’s equally rigid – fixed sampling intervals, predetermined sensor configurations, and no flexibility for experimental setups.
Then there’s the power issue. Running continuous measurements for weeks or months means either frequent battery changes (impractical in remote locations) or wired power (expensive infrastructure in the middle of a plantation). Neither option scales well.
How the New System Works
The breakthrough came from rethinking what a dendrometer actually needs to be. Instead of bundling everything into a proprietary black box, this system breaks monitoring into modular components that researchers can mix and match.
The core innovation is a digitised dendrometer that talks to the data logger through an I2C protocol. That technical detail matters because it solves three problems at once. First, by externalising the analog-to-digital converter, the device maintains fixed resolution regardless of environmental noise. Second, multiple dendrometers can share a single port on the logger; you don’t need separate high-resolution ADCs for each sensor. Third, the digital signal resists interference that would corrupt analog measurements.
Here’s what that looks like in practice: Six of these systems currently run at the IMPACT OAL research plantation, part of the EucXylo Research Chair funded by the Hans Merensky Legacy Foundation. Each station monitors a eucalyptus tree continuously, logging stem diameter changes every 15 minutes while simultaneously tracking air temperature, humidity, soil moisture, and light levels. No cables. No manual data collection. Just solar panels keeping everything running indefinitely.
The data streams wirelessly via LoRaWAN (Long-Range Wide Area Network) to a central gateway. During field testing, stations transmitted successfully from 3.4 kilometers away with a received signal strength of -107dBm. That’s farm-to-farm distance, not lab-bench performance.
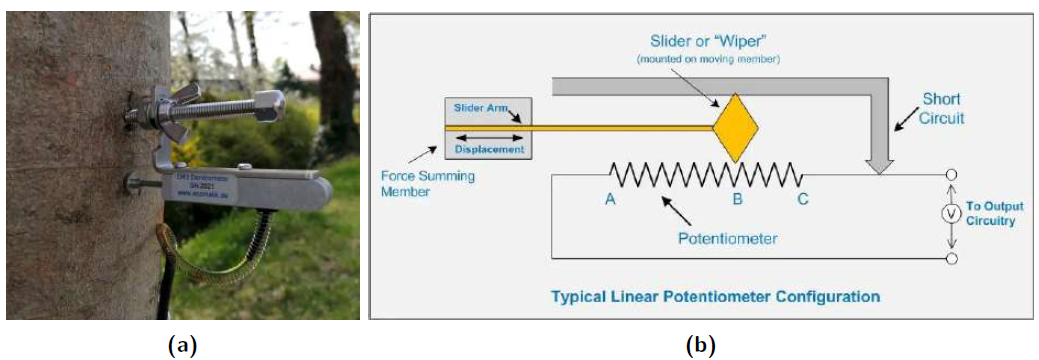
Figure 2: A DR3 point dendrometer attached to a tree stem and a diagram of the working principle of a potentiometer.
The Digital Twin That Predicts Problems
Temperature throws off sensor readings. So, when a linear potentiometer heats up, its resistance changes slightly. That shift translates directly into measurement drift. Your sensor reports the tree shrank when, in fact, the thermometer just climbed. Commercial systems handle this through expensive temperature compensation circuits or by using sensors with extremely low thermal coefficients. Both approaches inflate costs.
This research took a different path: build a computational model that predicts exactly how temperature affects measurements, then correct for it mathematically. They call it a digital twin – software that mirrors the physical dendrometer’s behavior under various conditions.
The digital twin accounts for thermal drift in the potentiometer, the ADC, and even the mounting bracket that expands and contracts with temperature swings. Feed it temperature data alongside stem measurements, and it calculates the real change in tree diameter versus the artifact from thermal expansion.
How well does it work?
The model predicted a thermal drift coefficient of -0.985 μm/°C. That means for every degree Celsius increase, the uncorrected reading drifts negative by about one micron. Over a 20°C temperature swing (common in field conditions), you’d accumulate -19.87 μm of error.
To validate the model, researchers ran 1,000 Monte Carlo simulations. Before applying calibration curves, the average RMSE across simulated dendrometers hit 129.40 μm. After calibration? 42.61 μm. That’s a 67% reduction in measurement error through math alone.
Real-World Performance
Simulation predictions mean nothing if hardware fails in actual conditions. So the team tested four dendrometer units against a precision digital micrometer in controlled laboratory conditions. They fitted 5th-order polynomial calibration curves to each device. All four achieved R² values exceeding 0.9995, meaning the calibration curves explained 99.95% of the variance in measurements. The average across all four units: 109.17 μm before calibration, 23.58 μm after. A 78% improvement.
Temperature sensitivity tests revealed thermal drift averaging -25.33 μm across a 20°C range, with a coefficient of -1.34 μm/°C. Slightly higher than the digital twin predicted, but in the same ballpark. A commercial Ekomatik DR1 dendrometer tested under identical conditions showed -19.87 μm drift at -0.981 μm/°C, better, but not dramatically so, especially considering its price premium.
But the real test happened outdoors. Ten wireless systems monitored eucalyptus trees for two months at field sites in South Africa and Portugal. Each station captured diurnal stem variation – the daily cycle of shrinking and swelling as trees transport water and respond to atmospheric conditions.
Trees don’t grow smoothly. They swell with water uptake during humid nights, then shrink during hot days as transpiration pulls moisture from cells. Vapour pressure deficit (VPD) drives this cycle, the difference between the actual moisture in the air and what the air could hold at saturation. High VPD means dry air that pulls water aggressively from leaves.
If your dendrometer accurately tracks stem variation, measurements should correlate strongly with VPD. The Stellenbosch deployment showed an average correlation of 0.71 between maximum daily shrinkage and VPD, with two units (DD1 and DD2) hitting 0.79. That’s strong evidence that the sensors captured real biological responses, not just noise.
Portugal sites showed a weaker correlation at 0.50 average, probably due to soil moisture. When roots can’t access water, trees stop responding to atmospheric demand. The dendrometers still worked, they just revealed different physiology.
Data Transmission That Actually Works
Wireless sounds great until you’re troubleshooting a remote sensor that stopped transmitting three weeks ago. Reliability matters more than range.
Over the two-month field test, the 10 systems transmitted 102,916 data points. The gateway received 97,841 of them; 95.1% retention. That’s production-ready performance. The missing 4.9% came from predictable sources: sensors briefly offline for maintenance, occasional interference from weather, and normal RF propagation issues.
To handle data gaps, the team developed a simple imputation algorithm. For randomly scattered missing values, it reconstructed measurements with RMSE below 5.2 μm, imperceptible in a biological context. Even consecutive two-day gaps (480 missing data points) could be filled with RMSE below 42.76 μm, preserving dataset continuity for analysis.
Range testing in rural environments confirmed 3.4 km of successful transmission. Urban or forested environments would reduce that; buildings and vegetation absorb radio signals, but most plantation research happens in relatively open terrain where LoRaWAN excels.
What This Means for Forest Management
Cost-effective monitoring changes what questions you can ask. Instead of deploying three expensive commercial dendrometers at a site, researchers can now deploy 30 of these systems. That shifts experimental design from intensive single-tree monitoring to extensive population-level studies.
The EucXylo Research Chair focuses on eucalypt ecophysiology and wood formation. Understanding how genetics, environment, and management practices interact requires data from hundreds of trees across multiple growing seasons. Before this system, that scale of monitoring wasn’t financially feasible. Now it is.
Six systems currently operate at IMPACT OAL. Plans call for expanding to 50 stations across the plantation, creating a sensor network that captures spatial variation in growth patterns. That density of coverage will reveal how local microclimates, soil conditions, and genetic differences affect wood quality, information directly applicable to plantation management.
The modular design means you’re not locked into eucalyptus research. Swap sensors and you’re monitoring soil respiration in a tropical forest. Add different instruments and you’re tracking sap flow in an orchard. The data logger doesn’t care what sensors you connect, as long as they speak I2C, SPI, SDI-12, or One-Wire protocols.
Solar power eliminates infrastructure requirements. No trenching for cables, no building electrical substations, no generator maintenance. Drop a station anywhere within LoRaWAN range, and it starts working. That accessibility matters enormously in regions where reliable electricity can’t be assumed.
For African researchers, where this system was developed, the implications go beyond forestry. The same platform can monitor agricultural trials, track wildlife habitat quality, or document ecosystem responses to climate change. Open-source design means local technical teams can assemble, modify, and repair units without depending on international suppliers or proprietary support contracts.
Where the Technology Goes Next
The digital twin currently models temperature effects comprehensively, but wind speed and direction also influence measurements. Mechanical vibration from wind moves the sensor arm, introducing noise that’s hard to distinguish from actual stem changes. Future model iterations could incorporate accelerometer data to filter mechanical artifacts.
Automated calibration would eliminate the manual micrometer procedure currently required for each unit. Early prototypes using stepper motors and 3D-printed fixtures show promise, but production versions need machined aluminum components and high-precision gears to match micrometer accuracy.
Machine learning could significantly improve the missing data imputation algorithm. The current approach uses simple interpolation, which works well for short gaps but struggles with extended outages. A trained model could recognize growth patterns and make intelligent predictions based on environmental conditions and seasonal trends.
Long-term reliability testing hasn’t happened yet. These systems have operated for months, not years. Component degradation, calibration drift over time, and life cycle performance remain open questions that extended deployment will answer.
Making the platform truly accessible means developing user-friendly interfaces. Right now, you need some technical knowledge to set up and configure units. A mobile app that handles device provisioning, network configuration, and data visualisation would lower barriers for field technicians and researchers without engineering backgrounds.
This system proves sophisticated environmental monitoring doesn’t require unlimited budgets. When research groups can deploy 10 sensors for the price of one commercial unit, they ask different questions and design better experiments. That’s how science advances, not through small improvements in existing tools, but through removing barriers that prevented whole categories of research.
For the full research, download Erasmus’s thesis and keep an eye on his upcoming publication.